
Experiment: Agent Evaluation via MLflow + OpenTelemetry
Date: 2026-06-09 Status: Complete Authors: @ascerra
Evaluates whether MLflow 3.x + OpenTelemetry can serve as a complete evaluation platform for autonomous AI agents in an SDLC pipeline — replacing ad-hoc "merge and hope" with instrumented, scored, regression-tested prompt changes.
Related: fullsend-ai/fullsend#1682 — functional eval pattern (complementary work)
Internal: The production versions of these scripts (harness, scorers, trace export, CI workflows) live at fullsend-ai/features. The examples here are simplified, standalone excerpts.
Hypothesis
A single platform (MLflow) combined with OpenTelemetry trace instrumentation can:
- Capture rich agent execution traces (tool calls, reasoning turns, cost, tokens) without modifying the agent runtime
- Score those traces with both mechanical (free, instant) and LLM-as-judge (semantic) scorers
- Gate PRs by triggering real agent runs against test fixtures and blocking merges that degrade quality
- Detect regressions in production via daily comparison against curated golden baselines
- Version prompts with staging/production aliases tied to git commits, enabling prompt-to-output lineage
If all five hold, teams can treat prompt engineering like software engineering — with CI, regression tests, and quality dashboards.
Background
The problem
Fullsend agents (triage, code, review, fix, retro ... eventually explore, refine, critique) run autonomously in sandboxed containers. When someone changes an agent prompt, there is:
- No quality metric — "did the explore agent get better at finding context?"
- No regression detection — a subtle change could break decomposition quality silently
- No before/after comparison — every PR is an opinion with zero supporting data
Prior art evaluated
| Tool/Approach | Finding |
|---|---|
| Arize Phoenix | Strong trace UI and evals, but no built-in prompt registry or alias-based versioning. OTLP ingest supported. |
| MLflow 3.x | OTLP traces, prompt versioning, quality dashboard, evaluation runs, datasets — all in one |
MLflow 3.x was chosen because it natively accepts OTLP traces, has a built-in Prompts Registry with aliasing, and its genai.evaluate() API logs Feedback objects that populate a Quality Dashboard without custom visualization work.
Architecture
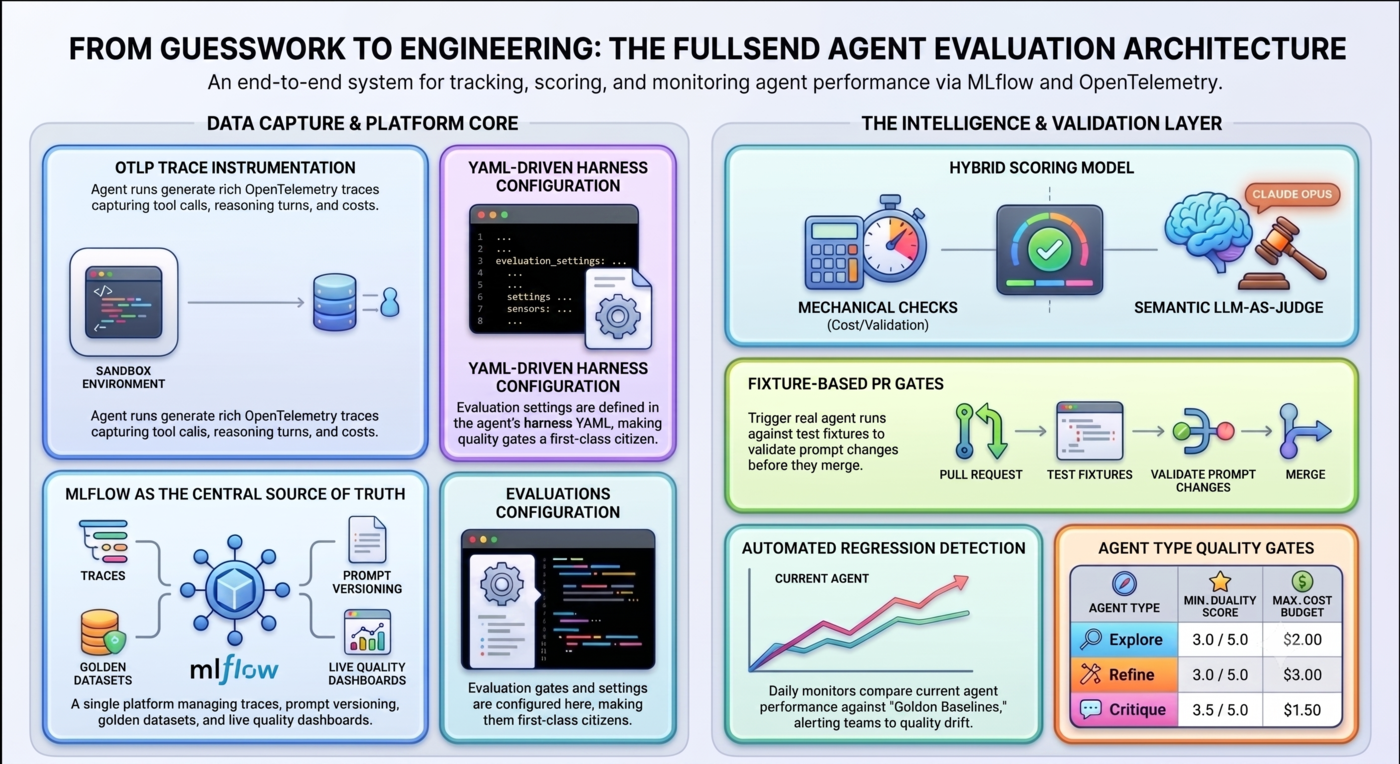
┌─────────────────────────────────────────────────────────────────┐
│                    DATA CAPTURE (OTLP)                          │
│                                                                 │
│  Agent sandbox ──► otel-trace-context.sh (W3C traceparent)      │
│       │            pipeline-events.sh (phase timing)            │
│       │            run-events.jsonl (CLI lifecycle)              │
│       ▼                                                         │
│  send-trace.py ──► OTLP HTTP POST ──► MLflow /v1/traces        │
│       │                                                         │
│       ├── set_mlflow_trace_tags()     (agent, work_item)        │
│       ├── fix_session_metadata()      (group by issue)          │
│       └── link_prompt_to_trace()      (@production lineage)     │
│                                                                 │
├─────────────────────────────────────────────────────────────────┤
│                    PLATFORM (MLflow 3.x)                        │
│                                                                 │
│  Traces ◄──────── Every agent run, with full span tree          │
│  Sessions ◄────── Grouped by work item (github:84, jira:TC-42) │
│  Prompts ◄─────── Versioned, @staging / @production aliases     │
│  Quality ◄─────── Dashboard with scorer trends over time        │
│  Eval Runs ◄───── mlflow.genai.evaluate() results               │
│  Datasets ◄────── Golden baselines for regression detection     │
│                                                                 │
├─────────────────────────────────────────────────────────────────┤
│                    SCORING                                       │
│                                                                 │
│  Mechanical (5)    │  LLM-as-Judge (8)                          │
│  ─────────────     │  ────────────────                          │
│  validation_passed │  explore_context_quality                   │
│  tool_efficiency   │  refine_decomposition_quality              │
│  cost_within_budget│  critique_verdict_accuracy                 │
│  confidence_coher. │  reasoning_coherence                       │
│  iteration_count   │  triage_action_correctness                 │
│                    │  triage_comment_quality                    │
│                    │  refine_confidence_honesty                 │
│                    │  refine_output_quality                     │
│                                                                 │
├─────────────────────────────────────────────────────────────────┤
│                    CI INTEGRATION                                │
│                                                                 │
│  eval-gate.yml ──── PR quality gate (fixture + scorer check)    │
│  eval-monitor.yml ─ Daily cron → score traces → Slack alert     │
│  register-prompts ─ @staging on PR, @production on merge        │
│                                                                 │
└─────────────────────────────────────────────────────────────────┘
Setup
Prerequisites
- MLflow 3.x instance with OTLP ingest enabled (
/v1/tracesendpoint) - Python 3.12+ with:
mlflow>=3.3,opentelemetry-api,opentelemetry-sdk,opentelemetry-exporter-otlp-proto-http - Anthropic SDK with Vertex AI support (
anthropic[vertex]) for LLM judges - GitHub Actions for CI (eval-gate, eval-monitor workflows)
Key design decisions
Post-hoc trace export, not live instrumentation — The agent runtime (sandbox) has no OTEL SDK. Instead, bash scripts record timing/IDs to JSONL files, and
send-trace.pyreconstructs the span tree after the run completes. This avoids coupling the agent to any observability library.Harness YAML as single source of truth — Each agent's eval configuration (scorers, gates, baselines) lives in its harness YAML alongside the agent config.
harness.pyresolves scorer names to Python functions at runtime.Hybrid scoring — Mechanical scorers are instant and free (pure Python checks on trace attributes). LLM judges run Claude Opus via Vertex AI for semantic quality evaluation. Both feed into the same MLflow Feedback system. Prefer keeping mechanical scorers on objective trace properties (cost, duration, tool counts, schema validation). Assessments that depend on LLM-generated fields (e.g. the agent's self-reported confidence) compound non-determinism if they feed baselines and regression detection — those belong in the LLM-judge tier.
Fixture-based PR gates — When a prompt changes, the CI triggers a real agent run against a known test issue, then scores the resulting trace. This is an n=1 smoke test, not statistical significance — production monitoring provides the longer-term signal.
Gate scales match scorer output — LLM judge scorers normalize rubric scores to 0–1 (
score / 5.0). Harness gates such asmin_quality_scoremust use that same 0–1 scale (e.g.0.6for a "3/5" bar), not the raw 1–5 rubric.
Results
Hypothesis 1: Capture — VALIDATED
Rich traces are captured for all three agent types without modifying the agent runtime. The span tree for a typical explore run contains 15-25 spans including:
| Span category | Examples | Count |
|---|---|---|
| Pipeline phases | pre-explore, post-explore | 4-6 |
| Fullsend lifecycle | load-harness, create-sandbox, agent-execution, validation | 6-8 |
| Agent reasoning | reasoning-1 through reasoning-N | 3-10 |
| Tool calls | tool:WebSearch, tool:Read, tool:Write | 5-15 |
| Results | fullsend:results | 1 |
Token counts (input/output), cost ($), latency (ms), and model name are logged as span attributes. Cross-run linking via OTEL Links connects explore → refine → critique traces.
Hypothesis 2: Score — VALIDATED
13 scorers implemented across two tiers:
| Tier | Count | Avg latency | Cost |
|---|---|---|---|
| Mechanical | 5 | <100ms | $0 |
| LLM Judge (Claude Opus) | 8 | 3-8s each | ~$0.02/scorer/trace |
Scorers receive mlflow.entities.Trace objects and return Feedback with value + rationale. MLflow's Quality Dashboard aggregates these automatically.
Key metric ranges observed (explore agent, n=15 traces):
| Scorer | Mean | Min | Max |
|---|---|---|---|
| validation_passed | 0.85 | 0.0 | 1.0 |
| tool_efficiency | 0.50 | 0.15 | 0.83 |
| cost_within_budget | 1.00 | 1.0 | 1.0 |
| confidence_coherence | 1.00 | 1.0 | 1.0 |
| reasoning_coherence | 0.71 | 0.40 | 1.0 |
| explore_context_quality | 0.72 | 0.40 | 1.0 |
cost_within_budget currently uses a fixed hard ceiling (e.g. $2.00 for explore). That validates "under budget" but does not surface cost trends — $1.90 and $0.04 both score 1.0. A follow-on improvement is deviation from a reference baseline mean (continuous signal) rather than a binary cap. See also methodology notes.
Hypothesis 3: PR Gate — VALIDATED
The eval-gate workflow successfully:
- Detected prompt changes in the PR diff (7s)
- Registered
@stagingprompt version in MLflow (~60s) - Triggered a real agent run against fixture issue (~10 min)
- Scored the resulting trace (mechanical + LLM judge)
- Posted pass/fail verdict to the PR as a comment
- Blocked merge when quality dropped below threshold
PR #92 fixture eval result: LLM judge score 4.0/5, cost $0.36, all mechanical checks passed. Total wall time: ~12 minutes.
Hypothesis 4: Regression Detection — VALIDATED (with caveats)
Daily monitoring workflow:
- Scores last 7 days of production traces per agent
- Compares against golden baseline means (10% regression threshold)
- Sends Slack alert with per-agent, per-scorer breakdown
Caveats:
- Golden baselines require manual curation.
create_golden.pyselects diverse traces and scores them, but the quality of the baseline depends on the quality of the traces available. Small n (< 10 traces) makes the baseline noisy. - Production-trace means mix heterogeneous work items and environments. A score drop can mean agent regression — or harder inputs, infra outages, interlaced human activity, or poorly described issues. Production means remain useful for observability and trend analysis, but evaluation baselines should prefer fixed, controlled fixture inputs (this experiment already has
fixtures/input.yamlandfixtures/rubric.yaml) so agent quality is isolated from environmental variance.
Hypothesis 5: Prompt Versioning — VALIDATED
MLflow Prompts Registry successfully tracks:
- Version history per agent (explore at v4, refine at v3, critique at v2)
@stagingalias set on PR,@productionon merge- Git commit + branch metadata per version
- Prompt-to-trace lineage via
link_prompt_versions_to_trace()
The Compare tab allows side-by-side diff of any two prompt versions.
Analysis
What worked well
OTLP ingest is seamless — MLflow accepts standard OTLP traces without any MLflow-specific SDK in the agent. This means the instrumentation works with any MLflow deployment.
Quality Dashboard is production-ready — Once Feedbacks are logged via
genai.evaluate(), the dashboard shows distributions, trends, and drill-down without custom visualization.Hybrid scoring is the right model — Mechanical scorers catch structural failures instantly (invalid JSON, budget blown, too many retries). LLM judges catch semantic issues (poor context quality, incoherent reasoning). Neither alone is sufficient.
Fixture-based PR gates give immediate signal — Even with n=1, a 4/5 judge score on a known test case gives more confidence than "I think this prompt is better."
What required iteration
Session metadata via OTLP is fragile — The
session.idspan attribute gets JSON-serialized with extra quotes by MLflow's OTLP ingester. Required a post-export patch viadeprecated_end_trace_v2(). This is a known MLflow bug.Cross-run trace linking needed custom work — OTEL Links are supported but MLflow's UI doesn't render them prominently. The session grouping (
mlflow.trace.sessiontag) is more useful for the UI than the Link relationship.LLM judge calibration is ongoing — The rubric scoring criteria need iteration. Initial judge prompts were too lenient (everything scored 4-5). Adding specific anchor descriptions for each score level improved discrimination.
Golden baseline bootstrapping is cold-start problem — You need production traces to create baselines, but you need baselines to detect regressions. We bootstrapped from early runs and plan to refresh quarterly.
Limitations
- Fixture eval is n=1 — A single test issue does not prove statistical significance. It's a smoke test.
- LLM judge reproducibility — Same trace scored twice can produce different scores (±0.5 typical). Averaging multiple judge runs would improve reliability but increases cost.
- No inline regression on PR — The PR gate tests the new prompt against a fixture, not against recent production traces. A prompt could pass the fixture but regress on real-world variety.
- Cost — LLM judges at ~$0.02/scorer/trace means scoring 100 traces with 8 judges costs ~$16. Acceptable for daily monitoring, expensive for bulk historical analysis.
Methodology notes (from review)
These are PoC caveats called out in review — not blockers for this experiment, but worth carrying into any production follow-on:
cost_within_budgetis a binary ceiling, not a trend signal. Prefer scoring deviation from a known baseline mean (e.g. % above/below reference) so cost regressions are continuous rather than pass/fail against a generous cap.confidence_coherencesits on LLM-generated self-reported confidence. That puts non-deterministic data under "mechanical" scoring. If those Feedbacks feed golden baselines and regression detection, non-determinism compounds across layers. Keep mechanical scorers on objective span attributes; move confidence assessment to the LLM-judge tier (alongside criteria likerefine_confidence_honesty).Gate thresholds must use the same scale as scorer Feedback. Example harness previously had
min_quality_score: 3.0(1–5 rubric) while judges emit 0–1 (score / 5.0). The example now uses0.6on the 0–1 scale.Golden baselines for evaluation should be fixture-driven. Averaging curated production traces is fine for monitoring, but controlled fixture runs are the right reference for pass/fail regression checks.
MLflow features not used
| Feature | Why not |
|---|---|
| MLflow Datasets API | Golden baselines stored as JSONL files, not uploaded via API. Could migrate for better UI integration. |
| MLflow Sessions UI (dedicated page) | Sessions tab returned 404 in our deployment (MLflow 3.12.0). Trace-level session column works. |
| Model Registry | Agents are not "models" in the traditional sense. Prompts Registry covers our versioning needs. |
| MLflow Deployments / AI Gateway | Not needed — agents deploy via GitHub Actions, not MLflow serving. |
Reproduction
Environment setup
# Install dependencies
pip install mlflow>=3.3 \
  opentelemetry-api opentelemetry-sdk \
  opentelemetry-exporter-otlp-proto-http \
  anthropic[vertex] pyyaml

# Configure MLflow connection
export MLFLOW_TRACKING_URI="https://<your-mlflow-instance>"
export MLFLOW_TRACKING_USERNAME="admin"
export MLFLOW_TRACKING_PASSWORD="<your-token>"
export OTEL_EXPORTER_OTLP_TRACES_ENDPOINT="https://<your-mlflow-instance>/v1/traces"
export MLFLOW_OTLP_TOKEN="<your-token>"

# For LLM judges via Vertex AI
export VERTEXAI_PROJECT="<your-gcp-project>"
export VERTEXAI_LOCATION="us-east5"
export GOOGLE_APPLICATION_CREDENTIALS="/path/to/credentials.json"
Running scorers on existing traces
# Score the last 7 days of traces for the explore agent
python3 examples/run_eval.py --agent explore --days 7 --max-traces 10

# Check for regressions against golden baseline
python3 examples/check_regression.py --agent explore --strict
Registering prompts
# Register a prompt with @staging alias
python3 examples/register_prompts.py --alias staging

# Promote to @production after merge
python3 examples/register_prompts.py --alias production
Key Files
agent-eval-mlflow-otel/
├── README.md                          # This document
├── examples/
│   ├── harness-explore.yaml           # Example harness config with eval section
│   ├── scorer_mechanical.py           # Mechanical scorer implementations
│   ├── scorer_llm_judge.py            # LLM-as-judge scorer implementations
│   ├── send_trace_example.py          # Simplified trace export example
│   ├── run_eval.py                    # Score traces via mlflow.genai.evaluate()
│   ├── check_regression.py            # Compare recent traces vs golden baseline
│   └── register_prompts.py            # MLflow Prompts Registry management
├── fixtures/
│   ├── input.yaml                     # Example fixture input
│   └── rubric.yaml                    # Example fixture rubric for LLM judge
├── diagrams/
│   └── architecture.png               # Architecture infographic
└── .gitignore
Recommendation
Adopt this pattern for any team running autonomous AI agents:
Instrument first — Add OTEL trace export to agent pipelines. The post-hoc pattern (collect artifacts, reconstruct spans) avoids coupling agents to observability libraries.
Start with mechanical scorers — They're free, instant, and catch the most obvious failures (invalid output, budget blown, excessive retries).
Add LLM judges for semantic quality — But calibrate the rubric carefully. Anchor each score level with specific descriptions.
Gate PRs with fixture evals — Even n=1 against a known test case provides meaningful signal. Trust production monitoring for statistical confidence.
Use prompt versioning — The
@staging/@productionalias pattern gives a clean promotion lifecycle tied to git commits.